Try this one if it will work.
Changes:
Code: Select all
v12
1. Modify epd reader now will read sts version 3.epd
2. Refactor winboard code, increase wait time for done=1
3. Updated STS 12, now using epd's with more alternatives on pos
1 to 23. There are 2 such files in official website, the other one
has less alternative moves.
4. Modify test set epd formats, opcodes are now in order, c0, c7, c8 and c9.
Test set is now at version 3
5. Display top 5 strong and weak test set results
6. Show test set title, in summary
7. Use latest version of psutil, the module that detects number
of logical and physical cores
Sample output.
Code: Select all
Intel(R) Core(TM) i7-2600K CPU @ 3.40GHz
Physical Cores: 4, Logical Cores: 8
Engine: Stockfish 6 64 POPCNT
Hash: 128, Threads: 1, time/pos: 0.188s
Number of positions in STS1-STS15_LAN_v3.epd: 1500
Max score = 1500 x 10 = 15000
Test duration: 00h:04m:53s
Expected time to finish: 00h:05m:27s
STS rating: 3395

  STS ID   STS1   STS2   STS3   STS4   STS5   STS6   STS7   STS8   STS9  STS10  STS11  STS12  STS13  STS14  STS15    ALL
  NumPos    100    100    100    100    100    100    100    100    100    100    100    100    100    100    100   1500
 BestCnt     83     77     75     71     76     75     70     68     69     80     73     72     77     74     49   1089
   Score    864    844    830    817    814    892    786    786    765    862    795    802    833    844    723  12257
Score(%)   86.4   84.4   83.0   81.7   81.4   89.2   78.6   78.6   76.5   86.2   79.5   80.2   83.3   84.4   72.3   81.7
  Rating   3604   3515   3453   3395   3381   3729   3257   3257   3163   3595   3297   3328   3466   3515   2976   3395

:: STS ID and Titles ::
STS 01: Undermining
STS 02: Open Files and Diagonals
STS 03: Knight Outposts
STS 04: Square Vacancy
STS 05: Bishop vs Knight
STS 06: Re-Capturing
STS 07: Offer of Simplification
STS 08: Advancement of f/g/h Pawns
STS 09: Advancement of a/b/c Pawns
STS 10: Simplification
STS 11: Activity of the King
STS 12: Center Control
STS 13: Pawn Play in the Center
STS 14: Queens and Rooks to the 7th rank
STS 15: Avoid Pointless Exchange

:: Top 5 STS with high result ::
1. STS 06, 89.2%, "Re-Capturing"
2. STS 01, 86.4%, "Undermining"
3. STS 10, 86.2%, "Simplification"
4. STS 02, 84.4%, "Open Files and Diagonals"
5. STS 14, 84.4%, "Queens and Rooks to the 7th rank"

:: Top 5 STS with low result ::
1. STS 15, 72.3%, "Avoid Pointless Exchange"
2. STS 09, 76.5%, "Advancement of a/b/c Pawns"
3. STS 07, 78.6%, "Offer of Simplification"
4. STS 08, 78.6%, "Advancement of f/g/h Pawns"
5. STS 11, 79.5%, "Activity of the King"
Download:
http://www.mediafire.com/download/kncmw ... ng_v12.rar
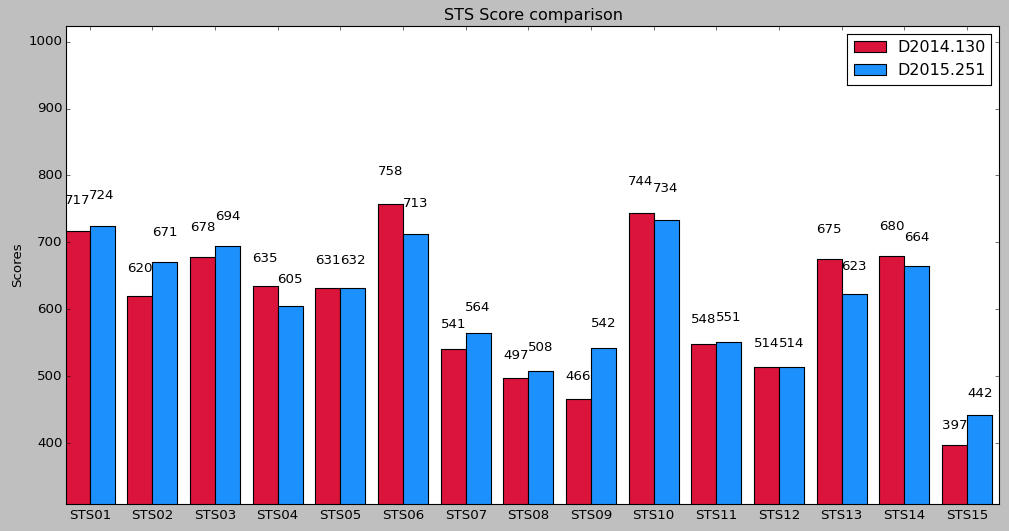
I have this script to plot results based from summary. Save summary of each engine to 1.txt, 2.txt, and 3.txt.
Sample summary.
Code: Select all
Intel(R) Core(TM) i7-2600K CPU @ 3.40GHz
Physical Cores: 4, Logical Cores: 8
Engine: Gaviota v1.0
Hash: 128, Threads: 1, time/pos: 0.200s
Number of positions in STS1-STS15_LAN_v3.epd: 1500
Max score = 1500 x 10 = 15000
Test duration: 00h:05m:27s
Expected time to finish: 00h:05m:45s

  STS ID   STS1   STS2   STS3   STS4   STS5   STS6   STS7   STS8   STS9  STS10  STS11  STS12  STS13  STS14  STS15    ALL
  NumPos    100    100    100    100    100    100    100    100    100    100    100    100    100    100    100   1500
 BestCnt     65     59     62     58     65     65     63     42     57     67     53     64     62     64     45    891
   Score    739    704    714    730    717    820    717    576    642    753    612    745    729    731    696  10625
Score(%)   73.9   70.4   71.4   73.0   71.7   82.0   71.7   57.6   64.2   75.3   61.2   74.5   72.9   73.1   69.6   70.8
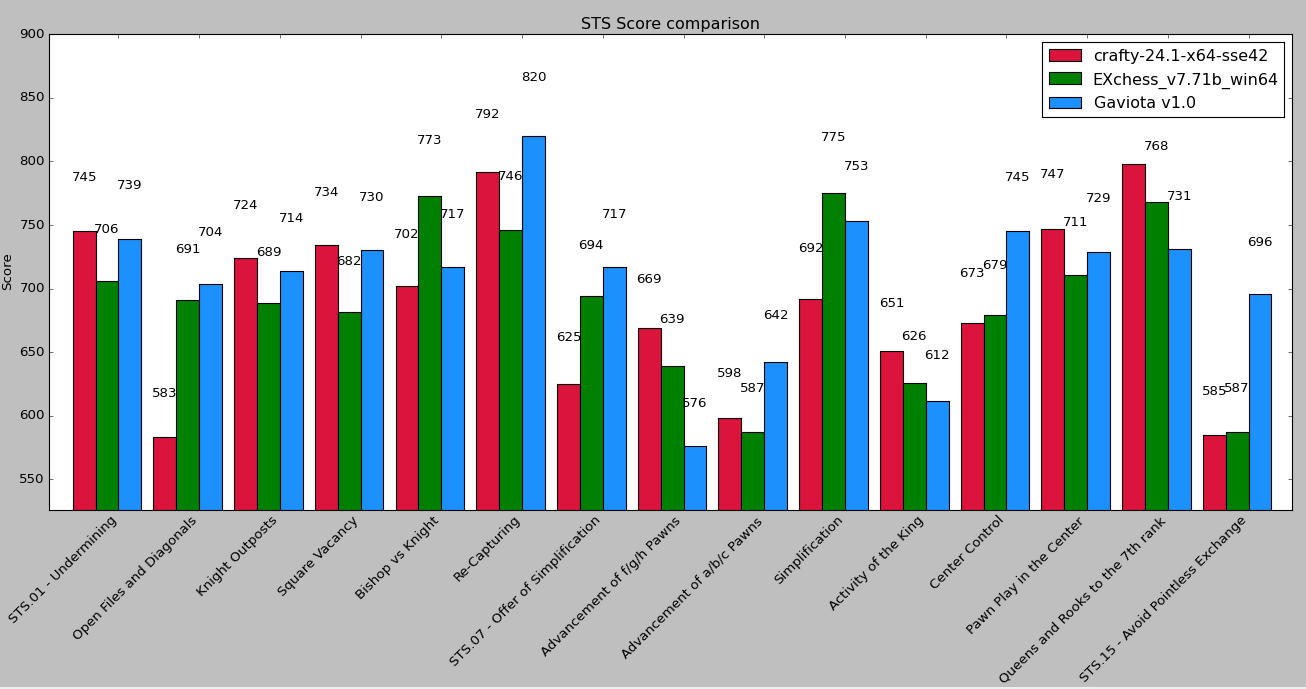
The plot for 3 engines for comparison.
Python script, you need to have matplotlib installed, and also python and numpy. The plot will be save in png format. I am not successful so far in converting this to exe file.
Code: Select all
# sts_chart_v2.py
# Python 2.7.6

import numpy as np
import matplotlib.pyplot as plt
import sys
import os


def autoLabel(rects, ax):
    """ Add labels """
    for rect in rects:
        height = rect.get_height()
        ax.text(rect.get_x()+rect.get_width()/2.,\
                1.05*height, '%d'%int(height),\
                ha='center', va='bottom')

def readData(f1, f2, f3):
    """ Read sts data for plotting
        f1 is from first engine and
        f2 is from second engine.
        The first line read in each file is the engine id name
    """
    data1 = []
    data2 = []
    data3 = []

    with open (f1, 'r') as fdata1:
        for lines in fdata1:
            line = lines.strip()
            if 'Engine:' in line:
                a = line.split(':')
                engine = a[1].strip()
                data1.append(engine)
            elif 'Score ' in line:
                a = ' '.join(line.split())
                a = a.split(' ')
                for i, n in enumerate(a):
                    if i > 0:
                        b = n.strip()
                        data1.append(int(b))

    # Delete the last entry since this is just the overall score
    del data1[-1]

    with open (f2, 'r') as fdata2:
        for lines in fdata2:
            line = lines.strip()
            if 'Engine:' in line:
                a = line.split(':')
                engine = a[1].strip()
                data2.append(engine)
            elif 'Score ' in line:
                a = ' '.join(line.split())
                a = a.split(' ')
                for i, n in enumerate(a):
                    if i > 0:
                        b = n.strip()
                        data2.append(int(b))
    del data2[-1]

    with open (f3, 'r') as fdata3:
        for lines in fdata3:
            line = lines.strip()
            if 'Engine:' in line:
                a = line.split(':')
                engine = a[1].strip()
                data3.append(engine)
            elif 'Score ' in line:
                a = ' '.join(line.split())
                a = a.split(' ')
                for i, n in enumerate(a):
                    if i > 0:
                        b = n.strip()
                        data3.append(int(b))
    del data3[-1]

    return (data1, data2, data3)


def plotSts():
    """ plot data from sts score"""

    # Check file
    file1 = '1.txt'
    file2 = '2.txt'
    file3 = '3.txt'

    # Check file1 and file 2 are existing
    if not os.path.isfile(file1):
        print 'file %s is missing?!' %file1
        raw_input('Press enter key to exit')
        sys.exit(1)
    if not os.path.isfile(file2):
        print 'file %s is missing?!' %file2
        raw_input('Press enter key to exit')
        sys.exit(1)
    if not os.path.isfile(file3):
        print 'file %s is missing?!' %file3
        raw_input('Press enter key to exit')
        sys.exit(1)

    e1, e2, e3 = readData(file1, file2, file3)

    e1name = e1[0]

    # Delete the first entry since this is just the engine id
    del e1[0]
    firstEngine = e1
    min1 = min(firstEngine)

    e2name = e2[0]
    del e2[0]
    secondEngine = e2
    min2 = min(secondEngine)

    e3name = e3[0]
    del e3[0]
    thirdEngine = e3
    min3 = min(thirdEngine)

    # Get the minimum score for plotting
    minval = min(min1, min2, min3)

    N = len(firstEngine)

    ind = np.arange(N) # For x axis
    # width = 0.30       # bar width
    margin = 0.05
    width = (1.-3.*margin)/3

    fig, ax = plt.subplots(figsize=(20,9))

    rects1 = ax.bar(ind, firstEngine, width, color='crimson')
    rects2 = ax.bar(ind+width, secondEngine, width, color='green')
    rects3 = ax.bar(ind+width+width, thirdEngine, width, color='dodgerblue')

    # add some text for labels, title and axes ticks
    minScore = minval - 50
    ax.set_ylim(minScore, 900)

    leftMargin = 0.3
    rightMargin = 0.1
    ax.set_xlim(0-leftMargin, 15+rightMargin)

    plt.subplots_adjust(bottom=0.25)

    ax.set_ylabel('Score')
    ax.set_title('STS Score comparison')
    ax.set_xticks(ind+width*2)
    ax.set_xticklabels( ('STS.01 - Undermining', 'Open Files and Diagonals', 'Knight Outposts',\
                         'Square Vacancy', 'Bishop vs Knight', 'Re-Capturing',\
                         'STS.07 - Offer of Simplification', 'Advancement of f/g/h Pawns',\
                         'Advancement of a/b/c Pawns', 'Simplification', 'Activity of the King',\
                         'Center Control', 'Pawn Play in the Center', 'Queens and Rooks to the 7th rank',\
                         'STS.15 - Avoid Pointless Exchange'), ha='right', rotation=45)

    ax.legend( (rects1[0], rects2[0], rects3[0]), (e1name, e2name, e3name) )

    autoLabel(rects1, ax)
    autoLabel(rects2, ax)
    autoLabel(rects3, ax)

    # Save to disk
    fig_fname = e1name + '_' + e2name + '_' + e3name + '_' + 'stsbar.png'

    # Delete existing file
    if os.path.isfile(fig_fname):
        os.remove(fig_fname)

    plt.savefig(fig_fname, format="png", dpi=300)

    plt.show()

if __name__ == "__main__":
    plotSts()