program style, risk aversion

Discussion of chess software programming and technical issues.

Moderators: hgm, Rebel, chrisw

User avatar
Don
Posts: 5106
Joined: Tue Apr 29, 2008 4:27 pm

program style, risk aversion

Post by Don »

When we talk about the playing style of people or computers it can be very subjective. But I have to wonder if there is some objective measurement of playing style. In another thread I proposed an experiment that tries to measure a programs willingness to take risks.

I think some people equate a "tactical" style with a willingness to take risk or an unwillingness to draw. Can we assume that the program that is better tactically also be the more "aggressive" player? I say no. In fact I put quotes around "tactical" and "aggressive" because I don't really know how to define that, it's a subjective judgement call.

The experiment is to play a series of round robins between programs that are time adjusted to play equal strength. When you have enough games, assuming the scores are the same, you should see that some programs have more wins and losses than others, even though they should all have the same 50% score. I'm not sure what to call this playing characteristic but it's one aspect of a programs style. It's a willingness to play in a such a way that you will lose more games to win more. So lt's call it "risk adverseness." One definition I saw applied this to investments:

Code: Select all

Definition of 'Risk Averse'

A description of an investor who, when faced with two investments with a similar expected return (but different risks), will prefer the one with the lower risk.
I think my experiment needs more than 3 players, but I am testing a development version of Komodo, Stockfish 2.3 and Houdini 3. After some experimentation I was able to time adjust the level of all three players such that no player seems to have a superiority. These are very fast games, the average time control being something around 15 seconds.

In the match Houdini has lost more games than the other 2, which implies that it is the least risk averse. Stockfish is the most risk averse - which means it would prefer to draw. But the difference between Stockfish and Komodo is very small, they are virtually the same in this regard and there is enough noise in the data that this could change as I run more games. I have always viewed Stockfish as more aggressive risk taker than Komodo but that was not based on any serious logic, just my highly subjective impression and my knowledge that it is quite strong tactically - but tactical skill has nothing to do with risk adverseness.

I'm still running the test, but here is the results so far - it was no small trick getting them to be so evenly matched and it took a few false starts:

Code: Select all


Rank    ELO     +/-    Games    Score  Player
---- ------- ------ -------- --------  ----------------------------
   1  3001.1    7.5     5679   50.264  kdev-4518.00 
   2  3000.0    7.5     5679   50.026  hou3         
   3  2998.5    7.5     5678   49.709  sf23         

w/l/d: 3092 2409 3017    35.42 percent draws


Here are the results based on Decisive game percentages, wins and draws:

Code: Select all


Decisive      Wins    Losses     Draws  Player
--------  --------  --------  --------  -------------------
   66.65     33.35     33.30     33.35  hou3
   63.60     32.07     31.54     36.40  kdev-4518.00
   63.49     31.45     32.04     36.51  sf23


I don't make any claims about what it all means. I don't even know for sure how to make a program behave one way or the other, how to create weights that cause the program to lose more games without weakening it. But I would assume that it's about the evaluation weights of dynamic terms more than anything else. Perhaps erring on the side of making the weight too high as opposed to too low? I don't know.

I would also like to explore other "style" measurements. The similarity tester compares 2 programs for some measure of stylistic similarity but it does not try to categorize a programs style - this test at least tries to measure one aspect of it.
Capital punishment would be more effective as a preventive measure if it were administered prior to the crime.
Joerg Oster
Posts: 937
Joined: Fri Mar 10, 2006 4:29 pm
Location: Germany

Re: program style, risk aversion

Post by Joerg Oster »

Don wrote:When we talk about the playing style of people or computers it can be very subjective. But I have to wonder if there is some objective measurement of playing style. In another thread I proposed an experiment that tries to measure a programs willingness to take risks.

I think some people equate a "tactical" style with a willingness to take risk or an unwillingness to draw. Can we assume that the program that is better tactically also be the more "aggressive" player? I say no. In fact I put quotes around "tactical" and "aggressive" because I don't really know how to define that, it's a subjective judgement call.
I'd agree, that tactically strong doesn't necessarily mean more aggressive.
Don wrote:The experiment is to play a series of round robins between programs that are time adjusted to play equal strength. When you have enough games, assuming the scores are the same, you should see that some programs have more wins and losses than others, even though they should all have the same 50% score. I'm not sure what to call this playing characteristic but it's one aspect of a programs style. It's a willingness to play in a such a way that you will lose more games to win more. So lt's call it "risk adverseness." One definition I saw applied this to investments:

Code: Select all

Definition of 'Risk Averse'

A description of an investor who, when faced with two investments with a similar expected return (but different risks), will prefer the one with the lower risk.
I think my experiment needs more than 3 players, but I am testing a development version of Komodo, Stockfish 2.3 and Houdini 3. After some experimentation I was able to time adjust the level of all three players such that no player seems to have a superiority. These are very fast games, the average time control being something around 15 seconds.

In the match Houdini has lost more games than the other 2, which implies that it is the least risk averse. Stockfish is the most risk averse - which means it would prefer to draw. But the difference between Stockfish and Komodo is very small, they are virtually the same in this regard and there is enough noise in the data that this could change as I run more games. I have always viewed Stockfish as more aggressive risk taker than Komodo but that was not based on any serious logic, just my highly subjective impression and my knowledge that it is quite strong tactically - but tactical skill has nothing to do with risk adverseness.

I'm still running the test, but here is the results so far - it was no small trick getting them to be so evenly matched and it took a few false starts:

Code: Select all


Rank    ELO     +/-    Games    Score  Player
---- ------- ------ -------- --------  ----------------------------
   1  3001.1    7.5     5679   50.264  kdev-4518.00 
   2  3000.0    7.5     5679   50.026  hou3         
   3  2998.5    7.5     5678   49.709  sf23         

w/l/d: 3092 2409 3017    35.42 percent draws


Here are the results based on Decisive game percentages, wins and draws:

Code: Select all


Decisive      Wins    Losses     Draws  Player
--------  --------  --------  --------  -------------------
   66.65     33.35     33.30     33.35  hou3
   63.60     32.07     31.54     36.40  kdev-4518.00
   63.49     31.45     32.04     36.51  sf23


I don't make any claims about what it all means. I don't even know for sure how to make a program behave one way or the other, how to create weights that cause the program to lose more games without weakening it. But I would assume that it's about the evaluation weights of dynamic terms more than anything else. Perhaps erring on the side of making the weight too high as opposed to too low? I don't know.

I would also like to explore other "style" measurements. The similarity tester compares 2 programs for some measure of stylistic similarity but it does not try to categorize a programs style - this test at least tries to measure one aspect of it.
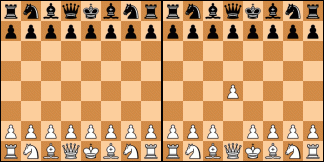
Interesting experiment.

One alternative comes into my mind.
-- Count the pawn moves up to move 20, 30, 40 etc.(e2-e4 counts as 2 moves) I would rate the engine with more pawn moves more aggressive.
Just an idea.

I would rate Stockfish a more aggressive engine than many others as well.
And though it is tactically quite strong, I think there are stronger ones.
Jörg Oster
User avatar
Ajedrecista
Posts: 1968
Joined: Wed Jul 13, 2011 9:04 pm
Location: Madrid, Spain.

My numeric method for determine draw trends of each engine.

Post by Ajedrecista »

Hello Don:
Don wrote:

Code: Select all

Decisive      Wins    Losses     Draws  Player
--------  --------  --------  --------  -------------------
   66.65     33.35     33.30     33.35  hou3
   63.60     32.07     31.54     36.40  kdev-4518.00
   63.49     31.45     32.04     36.51  sf23
I thought some months ago about comparing draw ratios of different engines with different scores. I see that you try to adjust different engines for playing with a similar strength and then you compare draw ratios. It is very interesting although I guess that the effort of adjust times of play of each engine is big.

My method of comparing draw ratios is the following:

a) Take a look to a well-known rating list (for example IPON). Other method is playing Round Robin tournaments as you did, but without time adjusts (if you do time adjusts, you have your method!).

b) Look at the score and the draw ratio of each engine.

Code: Select all

     IPON (13th December, 2012):

Rank   Name of the engine    Rating   +    -  Games   µ   <OR>    D

   1 Houdini 3 STD            3090   11   11  2850   82%  2826   24% 
   2 Komodo 5                 3007   10   10  2850   73%  2830   34% 
   3 Critter 1.4a             2986   10   10  2850   71%  2831   37% 
   4 Stockfish 2.2.2 JA       2968    9    9  2850   69%  2832   40% 
   5 Deep Rybka 4.1           2963   10   10  2850   68%  2833   40% 
   6 Chiron 1.5               2851    9    9  2850   52%  2838   42% 
   7 Deep Fritz 13 32b        2844    9    9  2850   51%  2839   40% 
   8 Naum 4.2                 2840    9    9  2850   50%  2839   42% 
   9 HIARCS 14 WCSC 32b       2824   10   10  2850   48%  2840   40% 
  10 Hannibal 1.2             2801   10   10  2850   45%  2841   40% 
     Gull 1.2                 2801   10   10  2850   45%  2841   39% 
  12 Deep Shredder 12         2800   10   10  2850   45%  2841   40% 
  13 Deep Sjeng c't 2010 32b  2792    9    9  2850   43%  2841   41% 
  14 Spike 1.4 32b            2780    9    9  2850   42%  2842   40% 
  15 spark-1.0                2771    9    9  2850   41%  2843   39% 
  16 Protector 1.4.0          2763   10   10  2850   39%  2843   39% 
  17 Deep Junior 13.3         2755   10   10  2850   39%  2843   34% 
  18 Quazar 0.4               2736   10   10  2850   36%  2844   37% 
  19 Zappa Mexico II          2709   10   10  2850   32%  2846   35% 
  20 MinkoChess 1.3           2698   10   10  2850   31%  2846   36%

Code: Select all

Score&#58; µ = &#40;wins + draws/2&#41;/games.
<OR>&#58; average opponents' rating.
Draw ratio&#58; D = draws/games.
c) Do some calculations that need an explanation by myself: given a score µ, a player/engine can have a maximum draw ratio.

Code: Select all

Win ratio&#58; W = wins/games.
Draw ratio&#58; D = draws/games.
Lose ratio&#58; L = loses/games.

Score&#58; µ = W + D/2.
1 - µ = D/2 + L.

Maximum draw ratio&#58; D_max = 2*min.&#40;µ, 1 - µ&#41; = min.&#40;2W + D, D + 2L&#41;.
&#40;D_max implies W = 0 or L = 0&#41;.

For the i-th player/engine&#58; k_i = D_i/D_max_i

µ can not be &#123;0, 1&#125;, otherwise my method does not work.
Then I compare parameters k_i for the complete list. In this case, IPON list rounds up to 1% both µ and D, so the results of k_i are not going to be exact:

Code: Select all

  Name of the engine      µ    D   D_max    k

Houdini 3 STD            82%  24%   36%  0.6667
Komodo 5                 73%  34%   54%  0.6296
Critter 1.4a             71%  37%   58%  0.6379
Stockfish 2.2.2 JA       69%  40%   62%  0.6452
Deep Rybka 4.1           68%  40%   64%  0.625
Chiron 1.5               52%  42%   96%  0.4375
Deep Fritz 13 32b        51%  40%   98%  0.4082
Naum 4.2                 50%  42%  100%  0.42
HIARCS 14 WCSC 32b       48%  40%   96%  0.4167
Hannibal 1.2             45%  40%   90%  0.4444
Gull 1.2                 45%  39%   90%  0.4333
Deep Shredder 12         45%  40%   90%  0.4444
Deep Sjeng c't 2010 32b  43%  41%   86%  0.4767
Spike 1.4 32b            42%  40%   84%  0.4762
spark-1.0                41%  39%   82%  0.4756
Protector 1.4.0          39%  39%   78%  0.5
Deep Junior 13.3         39%  34%   78%  0.4359
Quazar 0.4               36%  37%   72%  0.5139
Zappa Mexico II          32%  35%   64%  0.5469
MinkoChess 1.3           31%  36%   62%  0.5806
I am not sure if this parameter k is really useful or a waste of time. It looks like low values of k are expected with µ ~ 0.5 and high values of k are expected in the extremes of the rating list... maybe an additional factor is needed, like µ*(1 - µ). Results are rounded up to 0.0001:

Code: Select all

  Name of the engine      µ    D   D_max    k     k*µ*&#40;1 - µ&#41;

Houdini 3 STD            82%  24%   36%  0.6667     0.0984
Komodo 5                 73%  34%   54%  0.6296     0.1241
Critter 1.4a             71%  37%   58%  0.6379     0.1314
Stockfish 2.2.2 JA       69%  40%   62%  0.6452     0.138
Deep Rybka 4.1           68%  40%   64%  0.625      0.136
Chiron 1.5               52%  42%   96%  0.4375     0.1092
Deep Fritz 13 32b        51%  40%   98%  0.4082     0.102
Naum 4.2                 50%  42%  100%  0.42       0.105
HIARCS 14 WCSC 32b       48%  40%   96%  0.4167     0.104
Hannibal 1.2             45%  40%   90%  0.4444     0.11
Gull 1.2                 45%  39%   90%  0.4333     0.1073
Deep Shredder 12         45%  40%   90%  0.4444     0.11
Deep Sjeng c't 2010 32b  43%  41%   86%  0.4767     0.1169
Spike 1.4 32b            42%  40%   84%  0.4762     0.116
spark-1.0                41%  39%   82%  0.4756     0.1151
Protector 1.4.0          39%  39%   78%  0.5        0.119
Deep Junior 13.3         39%  34%   78%  0.4359     0.1037
Quazar 0.4               36%  37%   72%  0.5139     0.1184
Zappa Mexico II          32%  35%   64%  0.5469     0.119
MinkoChess 1.3           31%  36%   62%  0.5806     0.1242
According to the last column, Houdini 3 has the lowest trend to make draws while SF has the highest trend. An interesting study could be the next one: determine bounds in k*µ*(1 - µ) where an engine could be classified as a 'draw guru' (k*µ*(1 - µ) > 0.14 for example), a 'draw fear' (k*µ*(1 - µ) < 0.08 for example), etc.

I did not see before that k alone could be highly dependent of µ because I have not calculated k of many engines with so different scores, so I came up about multiplying k by µ*(1 - µ) just now, at the time of writing this post. I think that k*µ*(1 - µ) = µ*(1 - µ)*D/D_max is somewhat accurate for seeing the draw trend of each engine within their strength capabilities (higher k*µ*(1 - µ) means a higher trend to draw more games). In fact, k*µ*(1 - µ) can be µ*D/[2*(1 - µ)] or (1 - µ)*D/(2*µ) if I am not wrong. You can remove the number 2 for doing less calculations.

I did the calculations with a calculator so you may find typos although I do not expect them.

The main advantage of my method is avoid the time adjust; a drawback can be the calculations, but luckily they are easy (only multiplications and divisions!). Any comments, insights... are welcome.

Regards from Spain.

Ajedrecista.
User avatar
Don
Posts: 5106
Joined: Tue Apr 29, 2008 4:27 pm

Re: program style, risk aversion

Post by Don »

Joerg Oster wrote:
Don wrote:When we talk about the playing style of people or computers it can be very subjective. But I have to wonder if there is some objective measurement of playing style. In another thread I proposed an experiment that tries to measure a programs willingness to take risks.

I think some people equate a "tactical" style with a willingness to take risk or an unwillingness to draw. Can we assume that the program that is better tactically also be the more "aggressive" player? I say no. In fact I put quotes around "tactical" and "aggressive" because I don't really know how to define that, it's a subjective judgement call.
I'd agree, that tactically strong doesn't necessarily mean more aggressive.
Don wrote:The experiment is to play a series of round robins between programs that are time adjusted to play equal strength. When you have enough games, assuming the scores are the same, you should see that some programs have more wins and losses than others, even though they should all have the same 50% score. I'm not sure what to call this playing characteristic but it's one aspect of a programs style. It's a willingness to play in a such a way that you will lose more games to win more. So lt's call it "risk adverseness." One definition I saw applied this to investments:

Code: Select all

Definition of 'Risk Averse'

A description of an investor who, when faced with two investments with a similar expected return &#40;but different risks&#41;, will prefer the one with the lower risk.
I think my experiment needs more than 3 players, but I am testing a development version of Komodo, Stockfish 2.3 and Houdini 3. After some experimentation I was able to time adjust the level of all three players such that no player seems to have a superiority. These are very fast games, the average time control being something around 15 seconds.

In the match Houdini has lost more games than the other 2, which implies that it is the least risk averse. Stockfish is the most risk averse - which means it would prefer to draw. But the difference between Stockfish and Komodo is very small, they are virtually the same in this regard and there is enough noise in the data that this could change as I run more games. I have always viewed Stockfish as more aggressive risk taker than Komodo but that was not based on any serious logic, just my highly subjective impression and my knowledge that it is quite strong tactically - but tactical skill has nothing to do with risk adverseness.

I'm still running the test, but here is the results so far - it was no small trick getting them to be so evenly matched and it took a few false starts:

Code: Select all


Rank    ELO     +/-    Games    Score  Player
---- ------- ------ -------- --------  ----------------------------
   1  3001.1    7.5     5679   50.264  kdev-4518.00 
   2  3000.0    7.5     5679   50.026  hou3         
   3  2998.5    7.5     5678   49.709  sf23         

w/l/d&#58; 3092 2409 3017    35.42 percent draws


Here are the results based on Decisive game percentages, wins and draws:

Code: Select all


Decisive      Wins    Losses     Draws  Player
--------  --------  --------  --------  -------------------
   66.65     33.35     33.30     33.35  hou3
   63.60     32.07     31.54     36.40  kdev-4518.00
   63.49     31.45     32.04     36.51  sf23


I don't make any claims about what it all means. I don't even know for sure how to make a program behave one way or the other, how to create weights that cause the program to lose more games without weakening it. But I would assume that it's about the evaluation weights of dynamic terms more than anything else. Perhaps erring on the side of making the weight too high as opposed to too low? I don't know.

I would also like to explore other "style" measurements. The similarity tester compares 2 programs for some measure of stylistic similarity but it does not try to categorize a programs style - this test at least tries to measure one aspect of it.
Interesting experiment.

One alternative comes into my mind.
-- Count the pawn moves up to move 20, 30, 40 etc.(e2-e4 counts as 2 moves) I would rate the engine with more pawn moves more aggressive.
Just an idea.

I would rate Stockfish a more aggressive engine than many others as well.
And though it is tactically quite strong, I think there are stronger ones.
It's funny that you mention that because right after I posted I thought of counting pawn moves. Of course it remains to be determined what that would actually means. Does it mean you are a more aggressive player or could it mean something else?

A lot of weaker players hate to lose their queen and I have also played against players who were looking to trade their queen. It's easy to take advantage of both types of players but perhaps at higher levels there is such a bias too. So we could also look at willingness to simplify or swap down.

Another type of player never fails to lock up the pawns when he can. So there are various metrics of style that could be measured this way. For the draw percentage you need to normalize the strength but for some of these other metrics I think it's good enough to just be close in strength, not necessarily right on the money.
Capital punishment would be more effective as a preventive measure if it were administered prior to the crime.
User avatar
Don
Posts: 5106
Joined: Tue Apr 29, 2008 4:27 pm

Re: My numeric method for determine draw trends of each engi

Post by Don »

I would prefer to avoid having to do the time adjustment but I did not want to try to figure out the math or even if it was possible either. A huge issue is that draw rates are also dependent on strength.

When I saw Houdart's post showing Houdini with a relatively low draw rate my very first thought was that of course it had a low draw rate because it playing down. Komodo would have a low draw rate too if I were playing much weaker players.

I want to do a part 2 of this experiment where I quadruple the time control. I know that the current adjustment ratios will not work because this will make Houdini much lower and Stockfish much stronger. (Before anyone goes ballistic I'm not claiming that Houdini is not scalable, I'm just saying it's particularly strong at the hyper fast time control I am using here.) Stockfish is particularly weak at these super fast time controls but comes on very strong with more depth. It may be the most scalable program out there.

I'll try to wade through the math later and see if it makes sense to me but surely there is more noise in your method - any time you extrapolate (or interpolate) you lose some accuracy - so if it's sound I would suggest that you could use a hybrid approach - just make some educated guess adjustment to get you closer.

Ajedrecista wrote:Hello Don:
Don wrote:

Code: Select all

Decisive      Wins    Losses     Draws  Player
--------  --------  --------  --------  -------------------
   66.65     33.35     33.30     33.35  hou3
   63.60     32.07     31.54     36.40  kdev-4518.00
   63.49     31.45     32.04     36.51  sf23
I thought some months ago about comparing draw ratios of different engines with different scores. I see that you try to adjust different engines for playing with a similar strength and then you compare draw ratios. It is very interesting although I guess that the effort of adjust times of play of each engine is big.

My method of comparing draw ratios is the following:

a) Take a look to a well-known rating list (for example IPON). Other method is playing Round Robin tournaments as you did, but without time adjusts (if you do time adjusts, you have your method!).

b) Look at the score and the draw ratio of each engine.

Code: Select all

     IPON &#40;13th December, 2012&#41;&#58;

Rank   Name of the engine    Rating   +    -  Games   µ   <OR>    D

   1 Houdini 3 STD            3090   11   11  2850   82%  2826   24% 
   2 Komodo 5                 3007   10   10  2850   73%  2830   34% 
   3 Critter 1.4a             2986   10   10  2850   71%  2831   37% 
   4 Stockfish 2.2.2 JA       2968    9    9  2850   69%  2832   40% 
   5 Deep Rybka 4.1           2963   10   10  2850   68%  2833   40% 
   6 Chiron 1.5               2851    9    9  2850   52%  2838   42% 
   7 Deep Fritz 13 32b        2844    9    9  2850   51%  2839   40% 
   8 Naum 4.2                 2840    9    9  2850   50%  2839   42% 
   9 HIARCS 14 WCSC 32b       2824   10   10  2850   48%  2840   40% 
  10 Hannibal 1.2             2801   10   10  2850   45%  2841   40% 
     Gull 1.2                 2801   10   10  2850   45%  2841   39% 
  12 Deep Shredder 12         2800   10   10  2850   45%  2841   40% 
  13 Deep Sjeng c't 2010 32b  2792    9    9  2850   43%  2841   41% 
  14 Spike 1.4 32b            2780    9    9  2850   42%  2842   40% 
  15 spark-1.0                2771    9    9  2850   41%  2843   39% 
  16 Protector 1.4.0          2763   10   10  2850   39%  2843   39% 
  17 Deep Junior 13.3         2755   10   10  2850   39%  2843   34% 
  18 Quazar 0.4               2736   10   10  2850   36%  2844   37% 
  19 Zappa Mexico II          2709   10   10  2850   32%  2846   35% 
  20 MinkoChess 1.3           2698   10   10  2850   31%  2846   36%

Code: Select all

Score&#58; µ = &#40;wins + draws/2&#41;/games.
<OR>&#58; average opponents' rating.
Draw ratio&#58; D = draws/games.
c) Do some calculations that need an explanation by myself: given a score µ, a player/engine can have a maximum draw ratio.

Code: Select all

Win ratio&#58; W = wins/games.
Draw ratio&#58; D = draws/games.
Lose ratio&#58; L = loses/games.

Score&#58; µ = W + D/2.
1 - µ = D/2 + L.

Maximum draw ratio&#58; D_max = 2*min.&#40;µ, 1 - µ&#41; = min.&#40;2W + D, D + 2L&#41;.
&#40;D_max implies W = 0 or L = 0&#41;.

For the i-th player/engine&#58; k_i = D_i/D_max_i

µ can not be &#123;0, 1&#125;, otherwise my method does not work.
Then I compare parameters k_i for the complete list. In this case, IPON list rounds up to 1% both µ and D, so the results of k_i are not going to be exact:

Code: Select all

  Name of the engine      µ    D   D_max    k

Houdini 3 STD            82%  24%   36%  0.6667
Komodo 5                 73%  34%   54%  0.6296
Critter 1.4a             71%  37%   58%  0.6379
Stockfish 2.2.2 JA       69%  40%   62%  0.6452
Deep Rybka 4.1           68%  40%   64%  0.625
Chiron 1.5               52%  42%   96%  0.4375
Deep Fritz 13 32b        51%  40%   98%  0.4082
Naum 4.2                 50%  42%  100%  0.42
HIARCS 14 WCSC 32b       48%  40%   96%  0.4167
Hannibal 1.2             45%  40%   90%  0.4444
Gull 1.2                 45%  39%   90%  0.4333
Deep Shredder 12         45%  40%   90%  0.4444
Deep Sjeng c't 2010 32b  43%  41%   86%  0.4767
Spike 1.4 32b            42%  40%   84%  0.4762
spark-1.0                41%  39%   82%  0.4756
Protector 1.4.0          39%  39%   78%  0.5
Deep Junior 13.3         39%  34%   78%  0.4359
Quazar 0.4               36%  37%   72%  0.5139
Zappa Mexico II          32%  35%   64%  0.5469
MinkoChess 1.3           31%  36%   62%  0.5806
I am not sure if this parameter k is really useful or a waste of time. It looks like low values of k are expected with µ ~ 0.5 and high values of k are expected in the extremes of the rating list... maybe an additional factor is needed, like µ*(1 - µ). Results are rounded up to 0.0001:

Code: Select all

  Name of the engine      µ    D   D_max    k     k*µ*&#40;1 - µ&#41;

Houdini 3 STD            82%  24%   36%  0.6667     0.0984
Komodo 5                 73%  34%   54%  0.6296     0.1241
Critter 1.4a             71%  37%   58%  0.6379     0.1314
Stockfish 2.2.2 JA       69%  40%   62%  0.6452     0.138
Deep Rybka 4.1           68%  40%   64%  0.625      0.136
Chiron 1.5               52%  42%   96%  0.4375     0.1092
Deep Fritz 13 32b        51%  40%   98%  0.4082     0.102
Naum 4.2                 50%  42%  100%  0.42       0.105
HIARCS 14 WCSC 32b       48%  40%   96%  0.4167     0.104
Hannibal 1.2             45%  40%   90%  0.4444     0.11
Gull 1.2                 45%  39%   90%  0.4333     0.1073
Deep Shredder 12         45%  40%   90%  0.4444     0.11
Deep Sjeng c't 2010 32b  43%  41%   86%  0.4767     0.1169
Spike 1.4 32b            42%  40%   84%  0.4762     0.116
spark-1.0                41%  39%   82%  0.4756     0.1151
Protector 1.4.0          39%  39%   78%  0.5        0.119
Deep Junior 13.3         39%  34%   78%  0.4359     0.1037
Quazar 0.4               36%  37%   72%  0.5139     0.1184
Zappa Mexico II          32%  35%   64%  0.5469     0.119
MinkoChess 1.3           31%  36%   62%  0.5806     0.1242
According to the last column, Houdini 3 has the lowest trend to make draws while SF has the highest trend. An interesting study could be the next one: determine bounds in k*µ*(1 - µ) where an engine could be classified as a 'draw guru' (k*µ*(1 - µ) > 0.14 for example), a 'draw fear' (k*µ*(1 - µ) < 0.08 for example), etc.

I did not see before that k alone could be highly dependent of µ because I have not calculated k of many engines with so different scores, so I came up about multiplying k by µ*(1 - µ) just now, at the time of writing this post. I think that k*µ*(1 - µ) = µ*(1 - µ)*D/D_max is somewhat accurate for seeing the draw trend of each engine within their strength capabilities (higher k*µ*(1 - µ) means a higher trend to draw more games). In fact, k*µ*(1 - µ) can be µ*D/[2*(1 - µ)] or (1 - µ)*D/(2*µ) if I am not wrong. You can remove the number 2 for doing less calculations.

I did the calculations with a calculator so you may find typos although I do not expect them.

The main advantage of my method is avoid the time adjust; a drawback can be the calculations, but luckily they are easy (only multiplications and divisions!). Any comments, insights... are welcome.

Regards from Spain.

Ajedrecista.
Capital punishment would be more effective as a preventive measure if it were administered prior to the crime.
User avatar
Don
Posts: 5106
Joined: Tue Apr 29, 2008 4:27 pm

Re: program style, risk aversion

Post by Don »

I am now doing part 2 where I quadruple the time controls just to see if there are any surprises. I would expect all the draw ratio's to be higher of course but I also expect Houdini to remain the most "draw fearing" player with the most losses but also most wins.

Here is final result:

Code: Select all

drd@odie ~/autotest $ 
drd@odie ~/autotest $ rate ds01 hou3

Rank    ELO     +/-    Games    Score  Player
---- ------- ------ -------- --------  ----------------------------
   1  3001.6    5.5    10592   50.420  kdev-4518.00 
   2  3000.0    5.5    10590   50.080  hou3         
   3  2997.3    5.5    10590   49.500  sf23         

w/l/d&#58; 5751 4512 5623    35.40 percent draws


      TIME       RATIO    log&#40;r&#41;     NODES    log&#40;r&#41;  ave DEPTH    GAMES   PLAYER
 ---------  ----------  --------  --------  --------  ---------  -------   ------------
    0.1975       1.000     0.000     0.242     0.000    12.8961    10590   hou3
    0.3157       1.599     0.469     0.243     0.004    12.5131    10592   kdev-4518.00
    0.5799       2.937     1.077     0.449     0.618    15.7983    10590   sf23

drd@odie ~/autotest $ cat ds01.pgn | crosstable.tcl 

White         Black            winP       games     drawP
------------  ------------  -------  ----------  --------
hou3          kdev-4518.00    48.59        5296     32.80
hou3          sf23            51.57        5294     33.36
kdev-4518.00  hou3            51.41        5296     32.80
kdev-4518.00  sf23            49.43        5296     40.03
sf23          hou3            48.43        5294     33.36
sf23          kdev-4518.00    50.57        5296     40.03


Decisive      Wins    Losses     Draws  Player
--------  --------  --------  --------  -------------------
   66.92     33.54     33.38     33.08  hou3
   63.59     32.21     31.37     36.41  kdev-4518.00
   63.31     31.15     32.15     36.69  sf23
Capital punishment would be more effective as a preventive measure if it were administered prior to the crime.
User avatar
Don
Posts: 5106
Joined: Tue Apr 29, 2008 4:27 pm

Re: My numeric method for determine draw trends of each engi

Post by Don »

I did not walk through the math yet, I just read it through once but can I assume that you are looking at what the maximum number of draws can be given the score and doing something with that? For example if you are winning 90% of the games you cannot be drawing more than 20% of them. Then you are somehow comparing the actual draws to the maximum possible draws and perhaps looking at that ratio to understand risk averseness?
Capital punishment would be more effective as a preventive measure if it were administered prior to the crime.
jdart
Posts: 4366
Joined: Fri Mar 10, 2006 5:23 am
Location: http://www.arasanchess.org

Re: program style, risk aversion

Post by jdart »

I think you can also measure this by looking at evals.

Some programs have high king safety scores. Scorpio is one example, Stockfish also I think. Houdini's scores in similar positions seem to be much lower, in my experience (this leads to a somwhat different conclusion than yours about Houdini's style: I think it is very good at finding winning shots but not quick to make a sacrifice or risky move that may not win).

--Jon
User avatar
Don
Posts: 5106
Joined: Tue Apr 29, 2008 4:27 pm

Re: program style, risk aversion

Post by Don »

For reference purposes, I am playing these games on an i7-980x, a 6 core machine where I over-provision my tester to play 12 matches simultaneously.
Probably due to hyper-threading I can get more bang for the buck with the over-provisioning.

Komodo's contempt is set to zero, I think Houdini's defaults to -1 so I just left it as it was and Stockfish has zero built in. Hash table size is set to 64 meg and threads set to 1.

I fixed Houdini's time control to be 9 + 0.09 and compensated the other two accordingly.

sf23 fischer 24.6 + 0.246
komodo 14.3 0.143
Houdini 9 + 0.09.

In part 2 of the test I am multiplying all of these time controls by 4. It's already clear that this is not appropriate as some programs benefit more from this increase in time compared to others.

I'll keep you posted.
Capital punishment would be more effective as a preventive measure if it were administered prior to the crime.
Adam Hair
Posts: 3226
Joined: Wed May 06, 2009 10:31 pm
Location: Fuquay-Varina, North Carolina

Re: My numeric method for determine draw trends of each engi

Post by Adam Hair »

Ajedrecista wrote:Hello Don:
Don wrote:

Code: Select all

Decisive      Wins    Losses     Draws  Player
--------  --------  --------  --------  -------------------
   66.65     33.35     33.30     33.35  hou3
   63.60     32.07     31.54     36.40  kdev-4518.00
   63.49     31.45     32.04     36.51  sf23
I thought some months ago about comparing draw ratios of different engines with different scores. I see that you try to adjust different engines for playing with a similar strength and then you compare draw ratios. It is very interesting although I guess that the effort of adjust times of play of each engine is big.

My method of comparing draw ratios is the following:

a) Take a look to a well-known rating list (for example IPON). Other method is playing Round Robin tournaments as you did, but without time adjusts (if you do time adjusts, you have your method!).

b) Look at the score and the draw ratio of each engine.

Code: Select all

     IPON &#40;13th December, 2012&#41;&#58;

Rank   Name of the engine    Rating   +    -  Games   µ   <OR>    D

   1 Houdini 3 STD            3090   11   11  2850   82%  2826   24% 
   2 Komodo 5                 3007   10   10  2850   73%  2830   34% 
   3 Critter 1.4a             2986   10   10  2850   71%  2831   37% 
   4 Stockfish 2.2.2 JA       2968    9    9  2850   69%  2832   40% 
   5 Deep Rybka 4.1           2963   10   10  2850   68%  2833   40% 
   6 Chiron 1.5               2851    9    9  2850   52%  2838   42% 
   7 Deep Fritz 13 32b        2844    9    9  2850   51%  2839   40% 
   8 Naum 4.2                 2840    9    9  2850   50%  2839   42% 
   9 HIARCS 14 WCSC 32b       2824   10   10  2850   48%  2840   40% 
  10 Hannibal 1.2             2801   10   10  2850   45%  2841   40% 
     Gull 1.2                 2801   10   10  2850   45%  2841   39% 
  12 Deep Shredder 12         2800   10   10  2850   45%  2841   40% 
  13 Deep Sjeng c't 2010 32b  2792    9    9  2850   43%  2841   41% 
  14 Spike 1.4 32b            2780    9    9  2850   42%  2842   40% 
  15 spark-1.0                2771    9    9  2850   41%  2843   39% 
  16 Protector 1.4.0          2763   10   10  2850   39%  2843   39% 
  17 Deep Junior 13.3         2755   10   10  2850   39%  2843   34% 
  18 Quazar 0.4               2736   10   10  2850   36%  2844   37% 
  19 Zappa Mexico II          2709   10   10  2850   32%  2846   35% 
  20 MinkoChess 1.3           2698   10   10  2850   31%  2846   36%

Code: Select all

Score&#58; µ = &#40;wins + draws/2&#41;/games.
<OR>&#58; average opponents' rating.
Draw ratio&#58; D = draws/games.
c) Do some calculations that need an explanation by myself: given a score µ, a player/engine can have a maximum draw ratio.

Code: Select all

Win ratio&#58; W = wins/games.
Draw ratio&#58; D = draws/games.
Lose ratio&#58; L = loses/games.

Score&#58; µ = W + D/2.
1 - µ = D/2 + L.

Maximum draw ratio&#58; D_max = 2*min.&#40;µ, 1 - µ&#41; = min.&#40;2W + D, D + 2L&#41;.
&#40;D_max implies W = 0 or L = 0&#41;.

For the i-th player/engine&#58; k_i = D_i/D_max_i

µ can not be &#123;0, 1&#125;, otherwise my method does not work.
Then I compare parameters k_i for the complete list. In this case, IPON list rounds up to 1% both µ and D, so the results of k_i are not going to be exact:

Code: Select all

  Name of the engine      µ    D   D_max    k

Houdini 3 STD            82%  24%   36%  0.6667
Komodo 5                 73%  34%   54%  0.6296
Critter 1.4a             71%  37%   58%  0.6379
Stockfish 2.2.2 JA       69%  40%   62%  0.6452
Deep Rybka 4.1           68%  40%   64%  0.625
Chiron 1.5               52%  42%   96%  0.4375
Deep Fritz 13 32b        51%  40%   98%  0.4082
Naum 4.2                 50%  42%  100%  0.42
HIARCS 14 WCSC 32b       48%  40%   96%  0.4167
Hannibal 1.2             45%  40%   90%  0.4444
Gull 1.2                 45%  39%   90%  0.4333
Deep Shredder 12         45%  40%   90%  0.4444
Deep Sjeng c't 2010 32b  43%  41%   86%  0.4767
Spike 1.4 32b            42%  40%   84%  0.4762
spark-1.0                41%  39%   82%  0.4756
Protector 1.4.0          39%  39%   78%  0.5
Deep Junior 13.3         39%  34%   78%  0.4359
Quazar 0.4               36%  37%   72%  0.5139
Zappa Mexico II          32%  35%   64%  0.5469
MinkoChess 1.3           31%  36%   62%  0.5806
I am not sure if this parameter k is really useful or a waste of time. It looks like low values of k are expected with µ ~ 0.5 and high values of k are expected in the extremes of the rating list... maybe an additional factor is needed, like µ*(1 - µ). Results are rounded up to 0.0001:

Code: Select all

  Name of the engine      µ    D   D_max    k     k*µ*&#40;1 - µ&#41;

Houdini 3 STD            82%  24%   36%  0.6667     0.0984
Komodo 5                 73%  34%   54%  0.6296     0.1241
Critter 1.4a             71%  37%   58%  0.6379     0.1314
Stockfish 2.2.2 JA       69%  40%   62%  0.6452     0.138
Deep Rybka 4.1           68%  40%   64%  0.625      0.136
Chiron 1.5               52%  42%   96%  0.4375     0.1092
Deep Fritz 13 32b        51%  40%   98%  0.4082     0.102
Naum 4.2                 50%  42%  100%  0.42       0.105
HIARCS 14 WCSC 32b       48%  40%   96%  0.4167     0.104
Hannibal 1.2             45%  40%   90%  0.4444     0.11
Gull 1.2                 45%  39%   90%  0.4333     0.1073
Deep Shredder 12         45%  40%   90%  0.4444     0.11
Deep Sjeng c't 2010 32b  43%  41%   86%  0.4767     0.1169
Spike 1.4 32b            42%  40%   84%  0.4762     0.116
spark-1.0                41%  39%   82%  0.4756     0.1151
Protector 1.4.0          39%  39%   78%  0.5        0.119
Deep Junior 13.3         39%  34%   78%  0.4359     0.1037
Quazar 0.4               36%  37%   72%  0.5139     0.1184
Zappa Mexico II          32%  35%   64%  0.5469     0.119
MinkoChess 1.3           31%  36%   62%  0.5806     0.1242
According to the last column, Houdini 3 has the lowest trend to make draws while SF has the highest trend. An interesting study could be the next one: determine bounds in k*µ*(1 - µ) where an engine could be classified as a 'draw guru' (k*µ*(1 - µ) > 0.14 for example), a 'draw fear' (k*µ*(1 - µ) < 0.08 for example), etc.

I did not see before that k alone could be highly dependent of µ because I have not calculated k of many engines with so different scores, so I came up about multiplying k by µ*(1 - µ) just now, at the time of writing this post. I think that k*µ*(1 - µ) = µ*(1 - µ)*D/D_max is somewhat accurate for seeing the draw trend of each engine within their strength capabilities (higher k*µ*(1 - µ) means a higher trend to draw more games). In fact, k*µ*(1 - µ) can be µ*D/[2*(1 - µ)] or (1 - µ)*D/(2*µ) if I am not wrong. You can remove the number 2 for doing less calculations.

I did the calculations with a calculator so you may find typos although I do not expect them.

The main advantage of my method is avoid the time adjust; a drawback can be the calculations, but luckily they are easy (only multiplications and divisions!). Any comments, insights... are welcome.

Regards from Spain.

Ajedrecista.
Hi Jesús,

As you undoubtedly have noticed, k is negatively correlated with the average rating difference between an engine and its opponents. The highest and lowest rated engines in a list will have a higher k (in general) because they will have a lower draw rate.

Also, k is correlated with the average rating of the opponents of an engine. IIRC, this presents no problem for the IPON data, for every engine played each other. If CCRL data was used, then it would be a factor. Kirill Kryukov has a page demonstrating the correlation between draw rate and average rating difference and with the average rating of the opponents.

After stating the obvious, I would like to ask you about the motivation for using µ*(1-µ) as an adjustment factor and justification for using it. My brain is working slow this morning
and I have not determined why it is okay to use µ*(1-µ).

I find your post to be very interesting (even if I have not understood the use of µ*(1-µ)).

Adam
Last edited by Adam Hair on Thu Dec 13, 2012 5:39 pm, edited 1 time in total.