Don wrote:Robert wrote:Don wrote:At low depths the amount of ELO per doubling is quite large and at high depths it is much lower.
This is true (and quite logical) and it must be dependent of your BF too.
Higher the BF => less ELO gain per doubling.
Lower the BF => more ELO gain ....
Do you agree?
I agree that the lower the BF the more ELO gain for a properly written program. In fact it is the reason today's programs are so much stronger than programs of 20 years ago is because the very low BF. We do pay for this in quality but it's an excellent trade-off.
But I'm not sure it explains the low vs high ELO gain per doubling as the BF of most program don't vary that much at high depths.
I thought that the possible explanation for this is that being able to search x+1 plies instead of x plies does not give quite as much increase in Elo as being able to search x plies instead of x-1 plies.
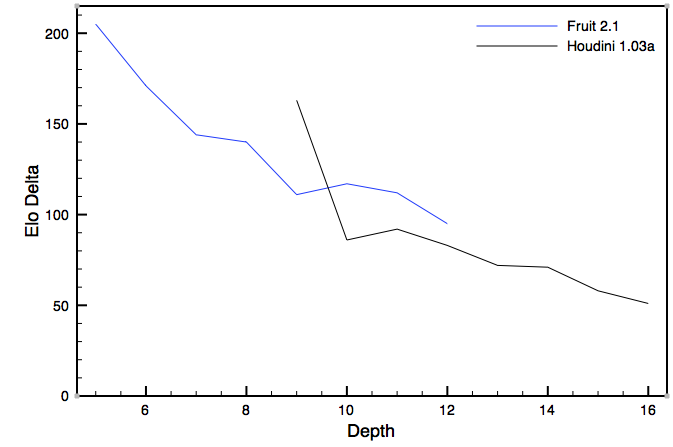
I have some data to share, but it is even less conclusive than I remembered.
First, here are some results from self-testing where Fruit 2.1 and Houdini 1.03 each play themselves at different depths (both were RR):
Code: Select all
Rank Name              Elo    +    - games score oppo. draws
   1 Fruit_2.1_ply12   482   18   18  1981   91%   -60   15%
   2 Fruit_2.1_ply11   387   16   16  1981   84%   -49   19%
   3 Fruit_2.1_ply10   275   15   15  1981   74%   -35   20%
   4 Fruit_2.1_ply9    158   14   14  1981   63%   -20   21%
   5 Fruit_2.1_ply8     47   13   13  1981   52%    -6   20%
   6 Fruit_2.1_ply7    -93   14   14  1981   39%    11   17%
   7 Fruit_2.1_ply6   -237   15   15  1982   28%    30   13%
   8 Fruit_2.1_ply5   -408   18   18  1982   15%    51   11%
   9 Fruit_2.1_ply4   -613   24   24  1982    4%    77    6%


Rank Name                 Elo    +    - games score oppo. draws
  1 Houdini_1.03a_ply16   287    8    8  3649   85%   -36   28%
  2 Houdini_1.03a_ply15   231    7    7  3648   79%   -29   32%
  3 Houdini_1.03a_ply14   173    7    7  3650   72%   -22   36%
  4 Houdini_1.03a_ply13   102    6    6  3648   63%   -13   39%
  5 Houdini_1.03a_ply12    30    6    6  3649   53%    -4   36%
  6 Houdini_1.03a_ply11   -53    6    6  3649   42%     7   33%
  7 Houdini_1.03a_ply10  -145    7    7  3649   30%    18   28%
  8 Houdini_1.03a_ply9   -231    8    8  3649   20%    29   21%
  9 Houdini_1.03a_ply8   -394   10   10  3649    7%    49   12%
There seems to be a trend where the Elo delta decreases as the depth increases, but not conclusively.
The next piece of data is a comparison of move selections made by Gaviota 0.84 when restricted to different depths. I randomly selected 1000 positions from the positions that come with the sim tool, then modified the tool so that it gave "go depth x" instead of "go infinite":
Code: Select all
Key:
  1) Gaviota 0.84 depth 02(time: 50 ms  scale: 1.0)
  2) Gaviota 0.84 depth 03(time: 50 ms  scale: 1.0)
  3) Gaviota 0.84 depth 04(time: 50 ms  scale: 1.0)
  4) Gaviota 0.84 depth 05(time: 50 ms  scale: 1.0)
  5) Gaviota 0.84 depth 06(time: 50 ms  scale: 1.0)
  6) Gaviota 0.84 depth 07(time: 50 ms  scale: 1.0)
  7) Gaviota 0.84 depth 08(time: 50 ms  scale: 1.0)
  8) Gaviota 0.84 depth 09(time: 50 ms  scale: 1.0)
  9) Gaviota 0.84 depth 10(time: 50 ms  scale: 1.0)
 10) Gaviota 0.84 depth 11(time: 50 ms  scale: 1.0)
 11) Gaviota 0.84 depth 12(time: 50 ms  scale: 1.0)
 12) Gaviota 0.84 depth 13(time: 50 ms  scale: 1.0)
 13) Gaviota 0.84 depth14(time: 50 ms  scale: 1.0)

         1     2     3     4     5     6     7     8     9    10    11    12    13
  1.  ----- 59.50 50.10 45.80 42.10 38.60 36.80 37.00 34.80 33.70 33.40 31.80 30.60
  2.  59.50 ----- 66.60 57.30 53.00 46.90 44.00 43.30 41.80 40.10 40.10 36.50 36.00
  3.  50.10 66.60 ----- 71.20 63.00 57.30 52.40 48.50 46.40 44.60 43.70 41.60 39.70
  4.  45.80 57.30 71.20 ----- 76.10 64.70 57.80 53.90 50.90 47.60 47.40 45.60 43.90
  5.  42.10 53.00 63.00 76.10 ----- 76.90 65.80 61.20 56.50 53.00 52.40 49.10 47.60
  6.  38.60 46.90 57.30 64.70 76.90 ----- 79.40 71.40 63.80 59.50 57.30 53.90 52.90
  7.  36.80 44.00 52.40 57.80 65.80 79.40 ----- 83.20 73.30 67.20 63.20 60.00 56.30
  8.  37.00 43.30 48.50 53.90 61.20 71.40 83.20 ----- 82.20 73.90 69.90 64.80 61.70
  9.  34.80 41.80 46.40 50.90 56.50 63.80 73.30 82.20 ----- 84.90 78.70 71.30 66.00
 10.  33.70 40.10 44.60 47.60 53.00 59.50 67.20 73.90 84.90 ----- 86.50 77.50 72.50
 11.  33.40 40.10 43.70 47.40 52.40 57.30 63.20 69.90 78.70 86.50 ----- 81.10 76.60
 12.  31.80 36.50 41.60 45.60 49.10 53.90 60.00 64.80 71.30 77.50 81.10 ----- 82.80
 13.  30.60 36.00 39.70 43.90 47.60 52.90 56.30 61.70 66.00 72.50 76.60 82.80 -----
Again, there does appear to be a trend, but not conclusively. In fact, the similarity between successive plies actually reduces twice, and then increases again.
If I had the resources, I would try even higher plies.
My speculation is that as the average depth searched becomes deeper and deeper, it is less likely in a game to find a better move than you could find searching one ply less. To me, that would seem to translate into less increase in Elo per doubling.
I do think I will revisit both of these types of measurements. Also, Miguel has suggested to me to measure the increase in Elo when the number of nodes is doubled.